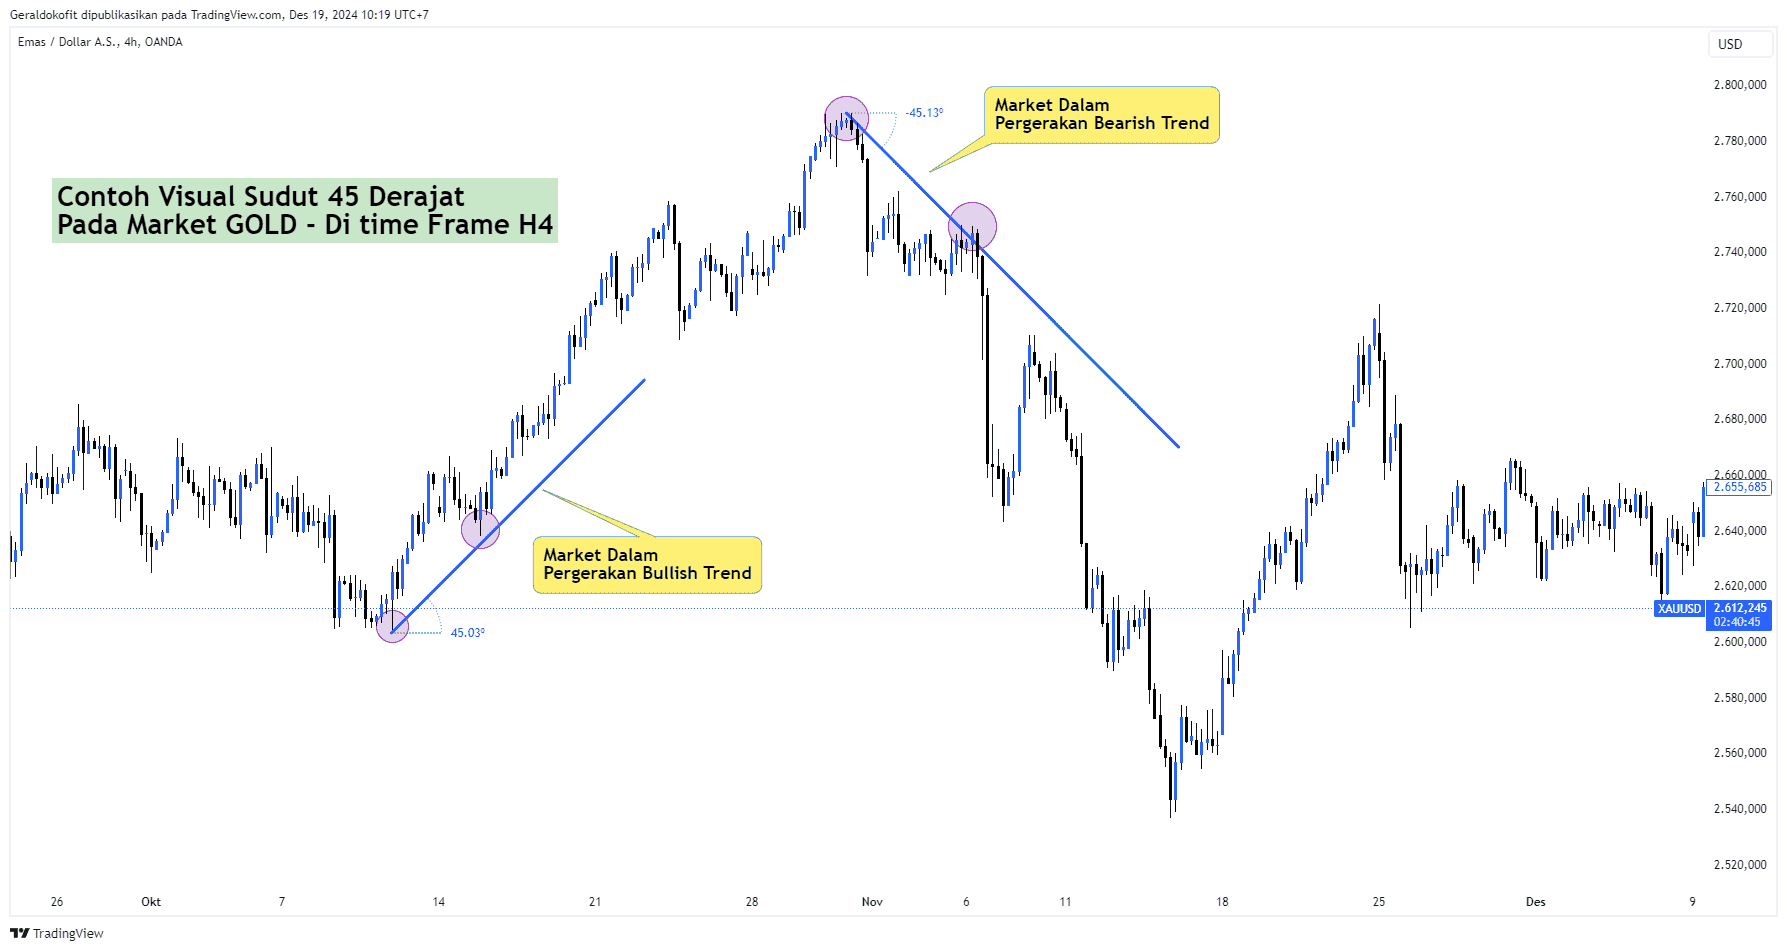
The 45-Degree Trend: An Indicator of Market Stability
In the world of market analysis, one concept often discussed is the 45-degree trend. This pattern represents stable and consistent price movement, whether in an uptrend or downtrend. Understanding this pattern can help traders and investors make more informed decisions when navigating market dynamics.
What Is the 45-Degree Trend?
The 45-degree trend refers to a price chart that moves at an angle close to 45 degrees relative to the horizontal axis. This angle indicates a steady rise or fall in price without extreme volatility. In an uptrend, it reflects healthy price growth, while in a downtrend, it shows a measured decline.
Why Is the 45-Degree Trend Important?
- Market Stability
The 45-degree trend is often considered an indicator of market stability. The absence of sharp spikes or drops signals a balanced phase in the market. - Trend Continuity
This pattern suggests a high probability that the price movement will continue in the same direction, giving traders time to plan their strategies. - Reduced Risk of Extreme Volatility
Because this pattern tends to be stable, the risk of sudden price swings is minimized.

Image I
Pair XAUUSD
How to Analyze and Use the 45-Degree Trend?
- Identify the Pattern on the Chart
Use charts with relevant timeframes (e.g., daily or weekly). Observe the angle of the trendline and ensure it approximates 45 degrees. - Confirm with Additional Indicators
Combine this analysis with other technical indicators, such as Moving Averages or RSI, to verify the strength of the trend. - Utilize for Entry and Exit Points
This trend is ideal for determining the right timing to enter or exit positions. For example, in a 45-degree uptrend, buy during price corrections and sell near resistance levels.
Conclusion
The 45-degree trend is a valuable tool in market analysis that helps traders understand the direction and stability of price movements. It represents an evolution in modern technical analysis, with its roots in Dow Theory and further refinements by William J. O’Neil and W.D. Gann. By effectively leveraging this pattern, traders can make wiser investment decisions and mitigate the risks of market volatility. Always pair this analysis with a solid risk management strategy for optimal results.
