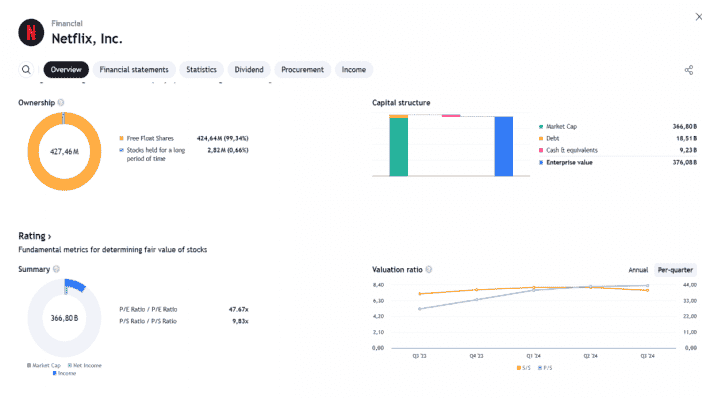
Netflix has a large market capitalization with a healthy capital structure. However, its high P/E and P/S ratios indicate that investors are paying a premium for its stock, likely due to expectations of future growth.
Here are the conclusions drawn from the data:
- Share Ownership:
- The majority of shares (427.46 million) are free float shares.
- A small portion (2.82 million) are long-term held shares.
- Capital Structure:
- Market Cap: $346 billion.
- Debt: $16 billion.
- Cash and Equivalents: $9.2 billion.
- Enterprise Value: $379 billion (combining equity market value and debt, minus cash).
- Rating and Valuation:
- P/E Ratio: 47.67x indicates the stock price is relatively high compared to net earnings.
- P/S Ratio: 9.21x suggests the stock price is quite high compared to revenue per share.
- The current market capitalization is $366 billion.
- Valuation Trends:
- The chart shows stable trends in annual and quarterly valuation ratios, with a slight increase from Q3 2023 to Q1 2024.